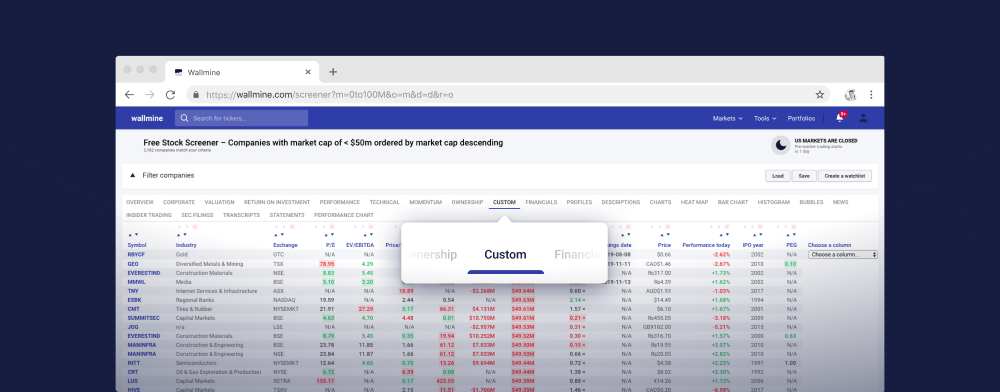
Free Stock Screener
Load Save Create a watchlist HelpQuarterly EPS estimates
Profit margin
Debt to assets
Cash flow
Balance sheet
 XSLX
XSLX
| (in millions USD) | 31 Mar 2024 | 31 Dec 2023 | |||
|---|---|---|---|---|---|
| Current assets | |||||
| Cash | $32,695 | $40,760 | |||
| Short term investments | $34,455 | $32,340 | |||
| Net receivables | $41,150 | $50,102 | |||
| Inventory | $6,232 | $6,511 | |||
| Total current assets | $128,416 | $143,692 | |||
| Long term investments | $95,187 | $99,475 | |||
| Property, plant & equipment | $43,546 | $43,666 | |||
| Goodwill & intangible assets | |||||
| Total noncurrent assets | $208,995 | $209,822 | |||
| Total investments | $129,642 | $131,815 | |||
| Total assets | $337,411 | $353,514 | |||
| Current liabilities | |||||
| Accounts payable | $45,753 | $58,146 | |||
| Deferred revenue | $8,012 | $8,264 | |||
| Short long term debt | $12,759 | $12,952 | |||
| Total current liabilities | $123,822 | $133,973 | |||
| Long term debt | $91,831 | $95,088 | |||
| Total noncurrent liabilities | $139,395 | $145,441 | |||
| Total debt | $104,590 | $108,040 | |||
| Total liabilities | $263,217 | $279,414 | |||
| Stockholders' equity | |||||
| Retained earnings | $4,339 | $8,242 | |||
| Other stockholder equity | -$8,960 | -$9,378 | |||
| Total stockholder equity | $74,194 | $74,100 | |||
| (in millions USD) | 2023 | 2022 | ||
|---|---|---|---|---|
| Current assets | ||||
| Cash | $29,965 | $23,646 | ||
| Short term investments | $31,590 | $24,658 | ||
| Net receivables | $60,985 | $60,932 | ||
| Inventory | $6,331 | $4,946 | ||
| Total current assets | $143,566 | $135,405 | ||
| Long term investments | $100,544 | $120,805 | ||
| Property, plant & equipment | $43,715 | $42,117 | ||
| Goodwill & intangible assets | ||||
| Total noncurrent assets | $209,017 | $217,350 | ||
| Total investments | $132,134 | $145,463 | ||
| Total assets | $352,583 | $352,755 | ||
| Current liabilities | ||||
| Accounts payable | $62,611 | $64,115 | ||
| Deferred revenue | $8,061 | $7,912 | ||
| Short long term debt | $15,807 | $21,110 | ||
| Total current liabilities | $145,308 | $153,982 | ||
| Long term debt | $95,281 | $98,959 | ||
| Total noncurrent liabilities | $145,129 | $148,101 | ||
| Total debt | $111,088 | $120,069 | ||
| Total liabilities | $290,437 | $302,083 | ||
| Stockholders' equity | ||||
| Retained earnings | -$214 | -$3,068 | ||
| Other stockholder equity | -$11,452 | -$11,109 | ||
| Total stockholder equity | $62,146 | $50,672 | ||
Income statement
| (in millions USD) | 31 Mar 2024 | 31 Dec 2023 | |||
|---|---|---|---|---|---|
| Revenue | |||||
| Total revenue | $90,753 | $119,575 | |||
| Cost of revenue | $48,482 | $64,720 | |||
| Gross profit | $42,271 | $54,855 | |||
| Operating activities | |||||
| Research & development | $7,903 | $7,696 | |||
| Selling, general & administrative | $6,468 | $6,786 | |||
| Total operating expenses | $14,371 | $14,482 | |||
| Operating income | $27,900 | $40,373 | |||
| Income from continuing operations | |||||
| EBIT | $28,058 | $40,323 | |||
| Income tax expense | $4,422 | $6,407 | |||
| Interest expense | |||||
| Net income | |||||
| Net income | $23,636 | $33,916 | |||
| Income (for common shares) | $23,636 | $33,916 | |||
| (in millions USD) | 2023 | 2022 | ||
|---|---|---|---|---|
| Revenue | ||||
| Total revenue | $383,285 | $394,328 | ||
| Cost of revenue | $214,137 | $223,546 | ||
| Gross profit | $169,148 | $170,782 | ||
| Operating activities | ||||
| Research & development | $29,915 | $26,251 | ||
| Selling, general & administrative | $24,932 | $25,094 | ||
| Total operating expenses | $54,847 | $51,345 | ||
| Operating income | $114,301 | $119,437 | ||
| Income from continuing operations | ||||
| EBIT | $117,669 | $122,034 | ||
| Income tax expense | $16,741 | $19,300 | ||
| Interest expense | $3,933 | $2,931 | ||
| Net income | ||||
| Net income | $96,995 | $99,803 | ||
| Income (for common shares) | $96,995 | $99,803 | ||
Cash flows
| (in millions USD) | 31 Mar 2024 | 31 Dec 2023 | |||
|---|---|---|---|---|---|
| Net income | $23,636 | $33,916 | |||
| Operating activities | |||||
| Depreciation | $2,836 | $2,848 | |||
| Business acquisitions & disposals | |||||
| Stock-based compensation | $2,964 | $2,997 | |||
| Total cash flows from operations | $22,690 | $39,895 | |||
| Investing activities | |||||
| Capital expenditures | -$1,996 | -$2,392 | |||
| Investments | $2,131 | $4,603 | |||
| Total cash flows from investing | -$310 | $1,927 | |||
| Financing activities | |||||
| Dividends paid | -$3,710 | -$3,825 | |||
| Sale and purchase of stock | -$23,205 | -$20,139 | |||
| Net borrowings | -$3,148 | -$3,984 | |||
| Total cash flows from financing | -$30,433 | -$30,585 | |||
| Effect of exchange rate | |||||
| Change in cash and equivalents | -$8,053 | $11,237 | |||
| (in millions USD) | 2023 | 2022 | ||
|---|---|---|---|---|
| Net income | $96,995 | $99,803 | ||
| Operating activities | ||||
| Depreciation | $11,519 | $11,104 | ||
| Business acquisitions & disposals | -$306 | |||
| Stock-based compensation | $10,833 | $9,038 | ||
| Total cash flows from operations | $110,543 | $122,151 | ||
| Investing activities | ||||
| Capital expenditures | -$10,959 | -$10,708 | ||
| Investments | $16,001 | -$9,560 | ||
| Total cash flows from investing | $3,705 | -$22,354 | ||
| Financing activities | ||||
| Dividends paid | -$15,025 | -$14,841 | ||
| Sale and purchase of stock | -$77,550 | -$89,402 | ||
| Net borrowings | -$9,901 | -$123 | ||
| Total cash flows from financing | -$108,488 | -$110,749 | ||
| Effect of exchange rate | ||||
| Change in cash and equivalents | $5,760 | -$10,952 | ||
Quarterly EPS estimates
Profit margin
Debt to assets
Cash flow
Balance sheet
| (in millions USD) | 31 Mar 2024 | 31 Dec 2023 | |||
|---|---|---|---|---|---|
| Current assets | |||||
| Cash | $80,021 | $81,017 | |||
| Short term investments | |||||
| Net receivables | $44,029 | $42,831 | |||
| Inventory | $1,304 | $1,615 | |||
| Total current assets | $147,180 | $147,393 | |||
| Long term investments | $14,807 | $13,367 | |||
| Property, plant & equipment | $138,746 | $128,706 | |||
| Goodwill & intangible assets | $147,991 | $148,827 | |||
| Total noncurrent assets | $337,095 | $323,165 | |||
| Total investments | $14,807 | $13,367 | |||
| Total assets | $484,275 | $470,558 | |||
| Current liabilities | |||||
| Accounts payable | $18,087 | $17,695 | |||
| Deferred revenue | $44,833 | $46,034 | |||
| Short long term debt | $22,784 | $29,291 | |||
| Total current liabilities | $118,525 | $121,016 | |||
| Long term debt | $57,127 | $59,083 | |||
| Total noncurrent liabilities | $112,598 | $111,274 | |||
| Total debt | $79,911 | $88,374 | |||
| Total liabilities | $231,123 | $232,290 | |||
| Stockholders' equity | |||||
| Retained earnings | $159,394 | $145,737 | |||
| Other stockholder equity | -$5,435 | -$4,949 | |||
| Total stockholder equity | $253,152 | $238,268 | |||
| (in millions USD) | 2023 | 2022 | ||
|---|---|---|---|---|
| Current assets | ||||
| Cash | $111,262 | $104,757 | ||
| Short term investments | ||||
| Net receivables | $48,688 | $44,261 | ||
| Inventory | $2,500 | $3,742 | ||
| Total current assets | $184,257 | $169,684 | ||
| Long term investments | $9,879 | $6,891 | ||
| Property, plant & equipment | $109,987 | $87,546 | ||
| Goodwill & intangible assets | $77,252 | $78,822 | ||
| Total noncurrent assets | $227,719 | $195,156 | ||
| Total investments | $9,879 | $6,891 | ||
| Total assets | $411,976 | $364,840 | ||
| Current liabilities | ||||
| Accounts payable | $18,095 | $19,000 | ||
| Deferred revenue | $53,813 | $48,408 | ||
| Short long term debt | $5,247 | $2,749 | ||
| Total current liabilities | $104,149 | $95,082 | ||
| Long term debt | $54,718 | $58,521 | ||
| Total noncurrent liabilities | $101,604 | $103,216 | ||
| Total debt | $59,965 | $61,270 | ||
| Total liabilities | $205,753 | $198,298 | ||
| Stockholders' equity | ||||
| Retained earnings | $118,848 | $84,281 | ||
| Other stockholder equity | -$6,343 | -$4,678 | ||
| Total stockholder equity | $206,223 | $166,542 | ||
Income statement
| (in millions USD) | 31 Mar 2024 | 31 Dec 2023 | |||
|---|---|---|---|---|---|
| Revenue | |||||
| Total revenue | $61,858 | $62,020 | |||
| Cost of revenue | $18,505 | $19,623 | |||
| Gross profit | $43,353 | $42,397 | |||
| Operating activities | |||||
| Research & development | $7,653 | $7,142 | |||
| Selling, general & administrative | $8,119 | $8,223 | |||
| Total operating expenses | $15,772 | $15,365 | |||
| Operating income | $27,581 | $27,032 | |||
| Income from continuing operations | |||||
| EBIT | $27,527 | $27,435 | |||
| Income tax expense | $4,788 | $4,656 | |||
| Interest expense | $800 | $909 | |||
| Net income | |||||
| Net income | $21,939 | $21,870 | |||
| Income (for common shares) | $21,939 | $21,870 | |||
| (in millions USD) | 2023 | 2022 | ||
|---|---|---|---|---|
| Revenue | ||||
| Total revenue | $211,915 | $198,270 | ||
| Cost of revenue | $65,863 | $62,650 | ||
| Gross profit | $146,052 | $135,620 | ||
| Operating activities | ||||
| Research & development | $27,195 | $24,512 | ||
| Selling, general & administrative | $30,334 | $27,725 | ||
| Total operating expenses | $57,529 | $52,237 | ||
| Operating income | $88,523 | $83,383 | ||
| Income from continuing operations | ||||
| EBIT | $91,279 | $85,779 | ||
| Income tax expense | $16,950 | $10,978 | ||
| Interest expense | $1,968 | $2,063 | ||
| Net income | ||||
| Net income | $72,361 | $72,738 | ||
| Income (for common shares) | $72,361 | $72,738 | ||
Cash flows
| (in millions USD) | 31 Mar 2024 | 31 Dec 2023 | |||
|---|---|---|---|---|---|
| Net income | $21,939 | $21,870 | |||
| Operating activities | |||||
| Depreciation | $6,027 | $5,959 | |||
| Business acquisitions & disposals | -$1,575 | -$65,029 | |||
| Stock-based compensation | $2,703 | $2,828 | |||
| Total cash flows from operations | $31,917 | $18,853 | |||
| Investing activities | |||||
| Capital expenditures | -$10,952 | -$9,735 | |||
| Investments | $3,108 | $1,492 | |||
| Total cash flows from investing | -$10,700 | -$71,925 | |||
| Financing activities | |||||
| Dividends paid | -$5,572 | -$5,574 | |||
| Sale and purchase of stock | -$3,691 | -$3,739 | |||
| Net borrowings | -$9,047 | -$633 | |||
| Total cash flows from financing | -$18,808 | -$10,147 | |||
| Effect of exchange rate | -$80 | $72 | |||
| Change in cash and equivalents | $2,329 | -$63,147 | |||
| (in millions USD) | 2023 | 2022 | ||
|---|---|---|---|---|
| Net income | $72,361 | $72,738 | ||
| Operating activities | ||||
| Depreciation | $13,861 | $14,460 | ||
| Business acquisitions & disposals | -$1,670 | -$22,038 | ||
| Stock-based compensation | $9,611 | $7,502 | ||
| Total cash flows from operations | $87,582 | $89,035 | ||
| Investing activities | ||||
| Capital expenditures | -$28,107 | -$23,886 | ||
| Investments | $10,213 | $18,438 | ||
| Total cash flows from investing | -$22,680 | -$30,311 | ||
| Financing activities | ||||
| Dividends paid | -$19,800 | -$18,135 | ||
| Sale and purchase of stock | -$20,379 | -$30,855 | ||
| Net borrowings | -$2,750 | -$9,023 | ||
| Total cash flows from financing | -$43,935 | -$58,876 | ||
| Effect of exchange rate | -$194 | -$141 | ||
| Change in cash and equivalents | $20,773 | -$293 | ||
GOOG
Quarterly EPS estimates
Profit margin
Debt to assets
Cash flow
Balance sheet
| (in millions USD) | 29 Sep 2022 | 29 Jun 2022 | |||
|---|---|---|---|---|---|
| Current assets | |||||
| Cash | $21,984 | $17,936 | |||
| Short term investments | $94,275 | $107,061 | |||
| Net receivables | $36,176 | $37,073 | |||
| Inventory | $3,156 | $1,980 | |||
| Total current assets | $166,109 | $172,371 | |||
| Long term investments | $30,419 | $30,665 | |||
| Property, plant & equipment | $122,040 | $119,621 | |||
| Goodwill & intangible assets | |||||
| Total noncurrent assets | |||||
| Total investments | |||||
| Total assets | $358,255 | $355,185 | |||
| Current liabilities | |||||
| Accounts payable | $6,303 | $4,409 | |||
| Deferred revenue | |||||
| Short long term debt | |||||
| Total current liabilities | $65,979 | $61,354 | |||
| Long term debt | $12,854 | $12,850 | |||
| Total noncurrent liabilities | |||||
| Total debt | |||||
| Total liabilities | $104,629 | $99,766 | |||
| Stockholders' equity | |||||
| Retained earnings | $196,220 | $196,845 | |||
| Other stockholder equity | -$8,852 | -$5,828 | |||
| Total stockholder equity | $253,626 | $255,419 | |||
| (in millions USD) | 2021 | 2020 | ||
|---|---|---|---|---|
| Current assets | ||||
| Cash | $20,945 | $26,465 | ||
| Short term investments | $118,704 | $110,229 | ||
| Net receivables | $40,270 | $31,384 | ||
| Inventory | $1,170 | $728 | ||
| Total current assets | $188,143 | $174,296 | ||
| Long term investments | $29,549 | $20,703 | ||
| Property, plant & equipment | $110,558 | $96,960 | ||
| Goodwill & intangible assets | ||||
| Total noncurrent assets | ||||
| Total investments | ||||
| Total assets | $359,268 | $319,616 | ||
| Current liabilities | ||||
| Accounts payable | $6,037 | $5,589 | ||
| Deferred revenue | ||||
| Short long term debt | $999 | |||
| Total current liabilities | $64,254 | $56,834 | ||
| Long term debt | $12,844 | $12,832 | ||
| Total noncurrent liabilities | ||||
| Total debt | ||||
| Total liabilities | $107,633 | $97,072 | ||
| Stockholders' equity | ||||
| Retained earnings | $191,484 | $163,401 | ||
| Other stockholder equity | -$1,623 | $633 | ||
| Total stockholder equity | $251,635 | $222,544 | ||
Income statement
| (in millions USD) | 29 Sep 2022 | 29 Jun 2022 | |||
|---|---|---|---|---|---|
| Revenue | |||||
| Total revenue | $69,092 | $69,685 | |||
| Cost of revenue | $31,158 | $30,104 | |||
| Gross profit | $37,934 | $39,581 | |||
| Operating activities | |||||
| Research & development | $10,273 | $9,841 | |||
| Selling, general & administrative | $10,526 | $10,287 | |||
| Total operating expenses | $51,957 | $50,232 | |||
| Operating income | $17,135 | $19,453 | |||
| Income from continuing operations | |||||
| EBIT | $17,135 | $19,453 | |||
| Income tax expense | $2,323 | $3,012 | |||
| Interest expense | -$101 | -$83 | |||
| Net income | |||||
| Net income | $13,910 | $16,002 | |||
| Income (for common shares) | $13,910 | $16,002 | |||
| (in millions USD) | 2021 | 2020 | ||
|---|---|---|---|---|
| Revenue | ||||
| Total revenue | $257,637 | $182,527 | ||
| Cost of revenue | $110,939 | $84,732 | ||
| Gross profit | $146,698 | $97,795 | ||
| Operating activities | ||||
| Research & development | $31,562 | $27,573 | ||
| Selling, general & administrative | $36,422 | $28,998 | ||
| Total operating expenses | $178,923 | $141,303 | ||
| Operating income | $78,714 | $41,224 | ||
| Income from continuing operations | ||||
| EBIT | $78,714 | $41,224 | ||
| Income tax expense | $14,701 | $7,813 | ||
| Interest expense | -$346 | -$135 | ||
| Net income | ||||
| Net income | $76,033 | $40,269 | ||
| Income (for common shares) | $76,033 | $40,269 | ||
Cash flows
| (in millions USD) | 29 Sep 2022 | 29 Jun 2022 | |||
|---|---|---|---|---|---|
| Net income | $13,910 | $16,002 | |||
| Operating activities | |||||
| Depreciation | $4,046 | $3,899 | |||
| Business acquisitions & disposals | |||||
| Stock-based compensation | |||||
| Total cash flows from operations | $23,353 | $19,422 | |||
| Investing activities | |||||
| Capital expenditures | -$7,276 | -$6,828 | |||
| Investments | $11,301 | $3,483 | |||
| Total cash flows from investing | -$833 | -$4,187 | |||
| Financing activities | |||||
| Dividends paid | |||||
| Sale and purchase of stock | |||||
| Net borrowings | -$674 | -$356 | |||
| Total cash flows from financing | -$18,097 | -$17,817 | |||
| Effect of exchange rate | -$375 | -$368 | |||
| Change in cash and equivalents | $4,048 | -$2,950 | |||
| (in millions USD) | 2021 | 2020 | ||
|---|---|---|---|---|
| Net income | $76,033 | $40,269 | ||
| Operating activities | ||||
| Depreciation | $12,430 | $13,679 | ||
| Business acquisitions & disposals | ||||
| Stock-based compensation | ||||
| Total cash flows from operations | $91,652 | $65,124 | ||
| Investing activities | ||||
| Capital expenditures | -$24,640 | -$22,281 | ||
| Investments | -$8,806 | -$9,822 | ||
| Total cash flows from investing | -$35,523 | -$32,773 | ||
| Financing activities | ||||
| Dividends paid | ||||
| Sale and purchase of stock | ||||
| Net borrowings | -$1,236 | $9,661 | ||
| Total cash flows from financing | -$61,362 | -$24,408 | ||
| Effect of exchange rate | -$287 | $24 | ||
| Change in cash and equivalents | -$5,520 | $7,967 | ||
GOOGL
Quarterly EPS estimates
Profit margin
Debt to assets
Cash flow
Balance sheet
| (in millions USD) | 31 Mar 2024 | 31 Dec 2023 | |||
|---|---|---|---|---|---|
| Current assets | |||||
| Cash | $24,493 | $24,048 | |||
| Short term investments | $83,597 | $86,868 | |||
| Net receivables | $44,552 | $47,964 | |||
| Inventory | |||||
| Total current assets | $165,471 | $171,530 | |||
| Long term investments | $33,994 | $31,008 | |||
| Property, plant & equipment | $156,950 | $148,436 | |||
| Goodwill & intangible assets | $29,183 | $29,198 | |||
| Total noncurrent assets | $241,879 | $230,862 | |||
| Total investments | $117,591 | $117,876 | |||
| Total assets | $407,350 | $402,392 | |||
| Current liabilities | |||||
| Accounts payable | $6,198 | $7,493 | |||
| Deferred revenue | $13,414 | $13,924 | |||
| Short long term debt | |||||
| Total current liabilities | $76,997 | $81,814 | |||
| Long term debt | $25,185 | $25,713 | |||
| Total noncurrent liabilities | $37,509 | $37,199 | |||
| Total debt | $25,185 | $25,713 | |||
| Total liabilities | $114,506 | $119,013 | |||
| Stockholders' equity | |||||
| Retained earnings | $219,770 | $211,247 | |||
| Other stockholder equity | -$4,839 | -$4,402 | |||
| Total stockholder equity | $292,844 | $283,379 | |||
| (in millions USD) | 2023 | 2022 | ||
|---|---|---|---|---|
| Current assets | ||||
| Cash | $24,048 | $21,879 | ||
| Short term investments | $86,868 | $91,883 | ||
| Net receivables | $47,964 | $40,258 | ||
| Inventory | $2,670 | |||
| Total current assets | $171,530 | $164,795 | ||
| Long term investments | $31,008 | $30,492 | ||
| Property, plant & equipment | $148,436 | $127,049 | ||
| Goodwill & intangible assets | $29,198 | $31,044 | ||
| Total noncurrent assets | $230,862 | $200,469 | ||
| Total investments | $117,876 | $122,375 | ||
| Total assets | $402,392 | $365,264 | ||
| Current liabilities | ||||
| Accounts payable | $7,493 | $5,128 | ||
| Deferred revenue | $13,924 | $12,877 | ||
| Short long term debt | ||||
| Total current liabilities | $81,814 | $69,300 | ||
| Long term debt | $25,713 | $27,202 | ||
| Total noncurrent liabilities | $37,199 | $39,820 | ||
| Total debt | $25,713 | $27,202 | ||
| Total liabilities | $119,013 | $109,120 | ||
| Stockholders' equity | ||||
| Retained earnings | $211,247 | $195,563 | ||
| Other stockholder equity | -$4,402 | -$7,603 | ||
| Total stockholder equity | $283,379 | $256,144 | ||
Income statement
| (in millions USD) | 31 Mar 2024 | 31 Dec 2023 | |||
|---|---|---|---|---|---|
| Revenue | |||||
| Total revenue | $80,539 | $86,310 | |||
| Cost of revenue | $33,712 | $37,575 | |||
| Gross profit | $46,827 | $48,735 | |||
| Operating activities | |||||
| Research & development | $11,903 | $12,113 | |||
| Selling, general & administrative | $9,452 | $12,925 | |||
| Total operating expenses | $21,355 | $25,038 | |||
| Operating income | $25,472 | $23,697 | |||
| Income from continuing operations | |||||
| EBIT | $28,409 | $24,481 | |||
| Income tax expense | $4,653 | $3,725 | |||
| Interest expense | $94 | $69 | |||
| Net income | |||||
| Net income | $23,662 | $20,687 | |||
| Income (for common shares) | $23,662 | $20,687 | |||
| (in millions USD) | 2023 | 2022 | ||
|---|---|---|---|---|
| Revenue | ||||
| Total revenue | $307,394 | $282,836 | ||
| Cost of revenue | $133,332 | $126,203 | ||
| Gross profit | $174,062 | $156,633 | ||
| Operating activities | ||||
| Research & development | $45,427 | $39,500 | ||
| Selling, general & administrative | $44,342 | $42,291 | ||
| Total operating expenses | $89,769 | $81,791 | ||
| Operating income | $84,293 | $74,842 | ||
| Income from continuing operations | ||||
| EBIT | $86,025 | $71,685 | ||
| Income tax expense | $11,922 | $11,356 | ||
| Interest expense | $308 | $357 | ||
| Net income | ||||
| Net income | $73,795 | $59,972 | ||
| Income (for common shares) | $73,795 | $59,972 | ||
Cash flows
| (in millions USD) | 31 Mar 2024 | 31 Dec 2023 | |||
|---|---|---|---|---|---|
| Net income | $23,662 | $20,687 | |||
| Operating activities | |||||
| Depreciation | $3,413 | $1,563 | |||
| Business acquisitions & disposals | -$61 | -$29 | |||
| Stock-based compensation | $5,264 | $5,659 | |||
| Total cash flows from operations | $28,848 | $18,915 | |||
| Investing activities | |||||
| Capital expenditures | -$12,012 | -$11,019 | |||
| Investments | $3,408 | $4,947 | |||
| Total cash flows from investing | -$8,564 | -$6,167 | |||
| Financing activities | |||||
| Dividends paid | |||||
| Sale and purchase of stock | -$18,625 | -$18,871 | |||
| Net borrowings | -$1,097 | -$437 | |||
| Total cash flows from financing | -$19,714 | -$19,308 | |||
| Effect of exchange rate | -$125 | -$94 | |||
| Change in cash and equivalents | $445 | -$6,654 | |||
| (in millions USD) | 2023 | 2022 | ||
|---|---|---|---|---|
| Net income | $73,795 | $59,972 | ||
| Operating activities | ||||
| Depreciation | $11,946 | $15,928 | ||
| Business acquisitions & disposals | -$495 | -$6,969 | ||
| Stock-based compensation | $22,460 | $19,362 | ||
| Total cash flows from operations | $101,746 | $91,495 | ||
| Investing activities | ||||
| Capital expenditures | -$32,251 | -$31,485 | ||
| Investments | $6,734 | $16,567 | ||
| Total cash flows from investing | -$27,063 | -$20,298 | ||
| Financing activities | ||||
| Dividends paid | ||||
| Sale and purchase of stock | -$71,341 | -$68,596 | ||
| Net borrowings | -$760 | -$1,196 | ||
| Total cash flows from financing | -$72,093 | -$69,757 | ||
| Effect of exchange rate | -$421 | -$506 | ||
| Change in cash and equivalents | $2,169 | $934 | ||
Quarterly EPS estimates
Profit margin
Debt to assets
Cash flow
Balance sheet
| (in millions USD) | 31 Mar 2024 | 31 Dec 2023 | |||
|---|---|---|---|---|---|
| Current assets | |||||
| Cash | $35,549 | $38,022 | |||
| Short term investments | |||||
| Net receivables | $52,835 | $51,260 | |||
| Inventory | $23,670 | $24,159 | |||
| Total current assets | |||||
| Long term investments | |||||
| Property, plant & equipment | $217,500 | $216,593 | |||
| Goodwill & intangible assets | $113,594 | $113,953 | |||
| Total noncurrent assets | |||||
| Total investments | $561,495 | $560,966 | |||
| Total assets | $1,070,035 | $1,069,978 | |||
| Current liabilities | |||||
| Accounts payable | $52,232 | $54,863 | |||
| Deferred revenue | $40,350 | $38,760 | |||
| Short long term debt | |||||
| Total current liabilities | |||||
| Long term debt | |||||
| Total noncurrent liabilities | |||||
| Total debt | $122,754 | $128,271 | |||
| Total liabilities | $492,250 | $499,208 | |||
| Stockholders' equity | |||||
| Retained earnings | $619,925 | $607,350 | |||
| Other stockholder equity | -$4,050 | -$3,763 | |||
| Total stockholder equity | $571,490 | $561,273 | |||
| (in millions USD) | 2023 | 2022 | ||
|---|---|---|---|---|
| Current assets | ||||
| Cash | $38,022 | $35,811 | ||
| Short term investments | ||||
| Net receivables | $51,260 | $48,301 | ||
| Inventory | $24,159 | $25,366 | ||
| Total current assets | ||||
| Long term investments | ||||
| Property, plant & equipment | $216,593 | $196,965 | ||
| Goodwill & intangible assets | $113,953 | $107,306 | ||
| Total noncurrent assets | ||||
| Total investments | $560,966 | $477,953 | ||
| Total assets | $1,069,978 | $948,452 | ||
| Current liabilities | ||||
| Accounts payable | $54,863 | $49,816 | ||
| Deferred revenue | $38,760 | $35,477 | ||
| Short long term debt | ||||
| Total current liabilities | ||||
| Long term debt | ||||
| Total noncurrent liabilities | ||||
| Total debt | $128,271 | $122,744 | ||
| Total liabilities | $499,208 | $467,835 | ||
| Stockholders' equity | ||||
| Retained earnings | $607,350 | $511,602 | ||
| Other stockholder equity | -$3,763 | -$6,591 | ||
| Total stockholder equity | $561,273 | $472,360 | ||
Income statement
| (in millions USD) | 31 Mar 2024 | 31 Dec 2023 | |||
|---|---|---|---|---|---|
| Revenue | |||||
| Total revenue | $91,745 | $130,190 | |||
| Cost of revenue | $69,438 | $74,743 | |||
| Gross profit | $22,307 | $55,447 | |||
| Operating activities | |||||
| Research & development | |||||
| Selling, general & administrative | $4,773 | $6,878 | |||
| Total operating expenses | $5,778 | $7,745 | |||
| Operating income | $16,529 | $47,702 | |||
| Income from continuing operations | |||||
| EBIT | $16,892 | $48,030 | |||
| Income tax expense | $2,874 | $9,180 | |||
| Interest expense | $1,316 | $1,276 | |||
| Net income | |||||
| Net income | $12,702 | $37,574 | |||
| Income (for common shares) | $12,702 | $37,574 | |||
| (in millions USD) | 2023 | 2022 | ||
|---|---|---|---|---|
| Revenue | ||||
| Total revenue | $439,337 | $234,190 | ||
| Cost of revenue | $289,520 | $237,787 | ||
| Gross profit | $149,817 | -$3,597 | ||
| Operating activities | ||||
| Research & development | ||||
| Selling, general & administrative | $22,605 | $19,506 | ||
| Total operating expenses | $26,621 | $24,490 | ||
| Operating income | $123,196 | -$28,087 | ||
| Income from continuing operations | ||||
| EBIT | $124,245 | -$26,985 | ||
| Income tax expense | $23,019 | -$8,518 | ||
| Interest expense | $5,003 | $4,352 | ||
| Net income | ||||
| Net income | $96,223 | -$22,819 | ||
| Income (for common shares) | $96,223 | -$22,819 | ||
Cash flows
| (in millions USD) | 31 Mar 2024 | 31 Dec 2023 | |||
|---|---|---|---|---|---|
| Net income | $12,702 | $37,574 | |||
| Operating activities | |||||
| Depreciation | $3,168 | $3,129 | |||
| Business acquisitions & disposals | -$327 | -$40 | |||
| Stock-based compensation | |||||
| Total cash flows from operations | $10,566 | $14,400 | |||
| Investing activities | |||||
| Capital expenditures | -$4,393 | -$5,708 | |||
| Investments | $1,680 | -$1,680 | |||
| Total cash flows from investing | -$3,203 | -$7,351 | |||
| Financing activities | |||||
| Dividends paid | |||||
| Sale and purchase of stock | -$2,562 | -$2,193 | |||
| Net borrowings | -$4,576 | $1,912 | |||
| Total cash flows from financing | -$9,802 | -$136 | |||
| Effect of exchange rate | -$44 | $126 | |||
| Change in cash and equivalents | -$2,483 | $7,039 | |||
| (in millions USD) | 2023 | 2022 | ||
|---|---|---|---|---|
| Net income | $96,223 | -$22,819 | ||
| Operating activities | ||||
| Depreciation | $12,486 | $10,899 | ||
| Business acquisitions & disposals | -$8,604 | -$10,594 | ||
| Stock-based compensation | ||||
| Total cash flows from operations | $49,196 | $37,224 | ||
| Investing activities | ||||
| Capital expenditures | -$19,409 | -$15,464 | ||
| Investments | -$5,335 | -$61,782 | ||
| Total cash flows from investing | -$32,663 | -$87,601 | ||
| Financing activities | ||||
| Dividends paid | ||||
| Sale and purchase of stock | -$9,171 | -$7,854 | ||
| Net borrowings | -$1,087 | $8,171 | ||
| Total cash flows from financing | -$14,405 | -$1,662 | ||
| Effect of exchange rate | $116 | -$268 | ||
| Change in cash and equivalents | $2,244 | -$52,307 | ||